
|
|
High-density anomalies: Cases that are both deviant and very normal
Some deviations in data are both unusual and very normal. Detecting these ‘high-density anomalies’ is relevant for data quality analysis, misbehavior detection and identifying deviations in noisy datasets. This brief article will summarize the most important findings. The full results can be found in the paper Algorithmic Frameworks for the Detection of High-Density Anomalies.
Governments, private companies and academic institutions nowadays collect a wealth of data. Anomaly detection (AD) is the task of analyzing these data collections to identify unusual occurrences. An anomaly is a case, or a group of cases, that is in some way different from the rest and does not fit the general patterns in the dataset. Such cases are often also referred to as outliers, deviants, novelties or discords. Anomaly detection can be used for a wide variety of purposes, such as data quality analysis, fraud detection, security and process monitoring and data preparation prior to statistical modelling.
Cases are traditionally considered more anomalous if they deviate with regard to more attributes or exhibit more extreme or rare values. However, it has also been acknowledged that anomalies can be deviant regarding a single attribute or a small selection of attributes, while showing unremarkable behavior for the other attributes.
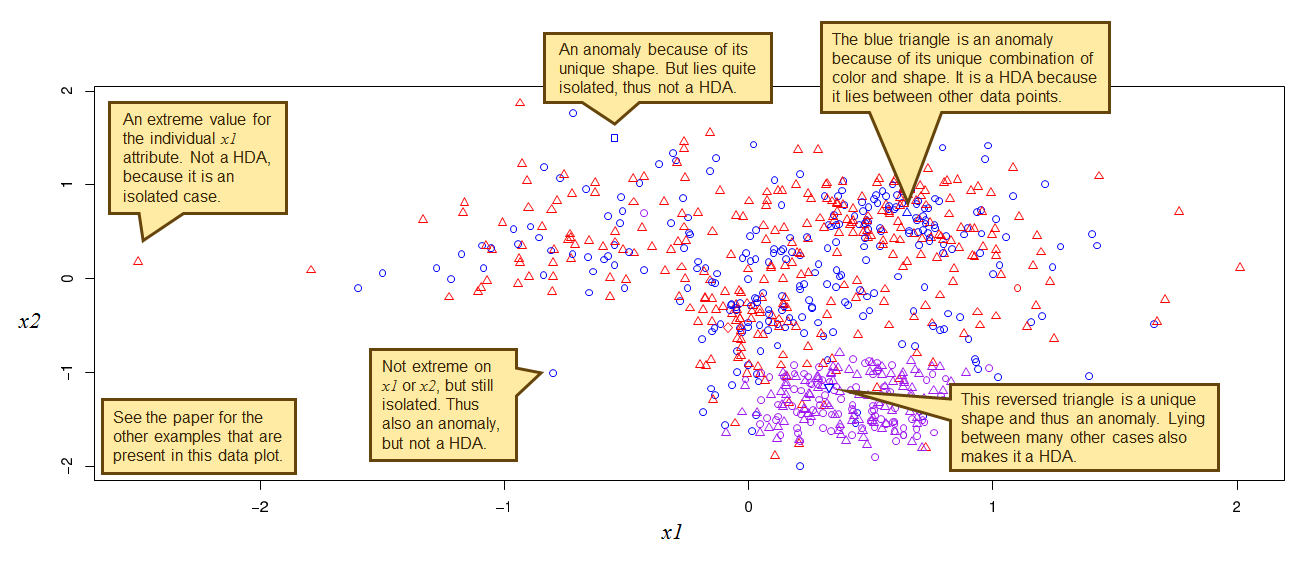
A special kind of deviation in this context is the high-density anomaly (HDA). This is an occurrence that deviates from the norm, but regarding a selection of attributes (the so-called ‘dentributes’) is also located in a high-density region. In other words, it is positioned amongst or is a member of the most normal cases. High-density anomalies can be interpreted as deviant occurrences that hide in normality, or hide in numbers. They ‘try’ to mask their deviating nature by exhibiting the most normal behavior possible for their situation. Contrary to traditional anomalies, which are typically conceptualized as low-density (isolated) cases, high-density anomalies hide between the most normal data points. As such they are not detected by traditional AD algorithms or, if identified, get assigned a modest anomaly score. Identifying them implies finding a solution to the problem of balancing between anomalousness and normalness (neighborhood density). Figure 1 presents a couple of examples.
The most important practical applications for HDA analysis are:
- Misbehavior detection: Detecting cases that are unusual, but that seem to be hiding between the most normal data. HDA analysis is relevant here because fraudsters and other transgressors will generally try to keep their behavior as close as possible to normal and legitimate actions.
- Analysis of noisy datasets: Anomaly detection on datasets that contain noise in which one is not interested. Noise will manifest itself as random low-density data points that one will often want to ignore because they do not represent relevant information.
- Data quality analysis: Conducting an exploratory analysis of the quality of the most common data. Putting the focus on the most normal (‘high-density’) data may be worthwhile because this implies analyzing large numbers of cases. For this reason it is valuable to learn more about these data in order to be able to implement, for example, follow-up quality checks, online corrections or software improvements to optimize live systems.
In general, using a HDA approach is particularly important when the datasets are large and the analyst should not spend time with false positives (i.e. the uninteresting isolated noise cases).
Dozens of different types of anomalies may be present in datasets (see the publication “On the Nature and Types of Anomalies: A Review” for a full overview of types and the five fundamental theoretical dimensions that define the nature of anomalies). When merely looking at the most basic and natural form of HDA, only several of these anomaly types acknowledged in the typology are able to manifest themselves as high-density anomalies. However, in principle all anomalies could be high-density anomalies if additional attributes that represent the high-density subspace are taken into account.
There are several methods to detect high-density anomalies. Two algorithmic frameworks for HDA detection have been introduced in the HDA research paper. They are frameworks in the sense that they, as part of the overall HDA detection process, make use of existing, traditional general-purpose AD algorithms (examples of these underlying algorithms that may be used are k-Nearest Neighbors, LOF and SECODA). The frameworks are:
- Iterative Partial Push (IPP): This approach iteratively walks through the dataset to filter (push) out the low-density cases from the set of anomalies.
- Harmonic Mean Detection of HDAs (HMDH): This approach calculates a (weighted or non-weighted) harmonic mean of the scores for anomalousness and neighborhood density.
More information can be found in the paper, and the code to execute these methods can be found on the page SECODA resources for R.
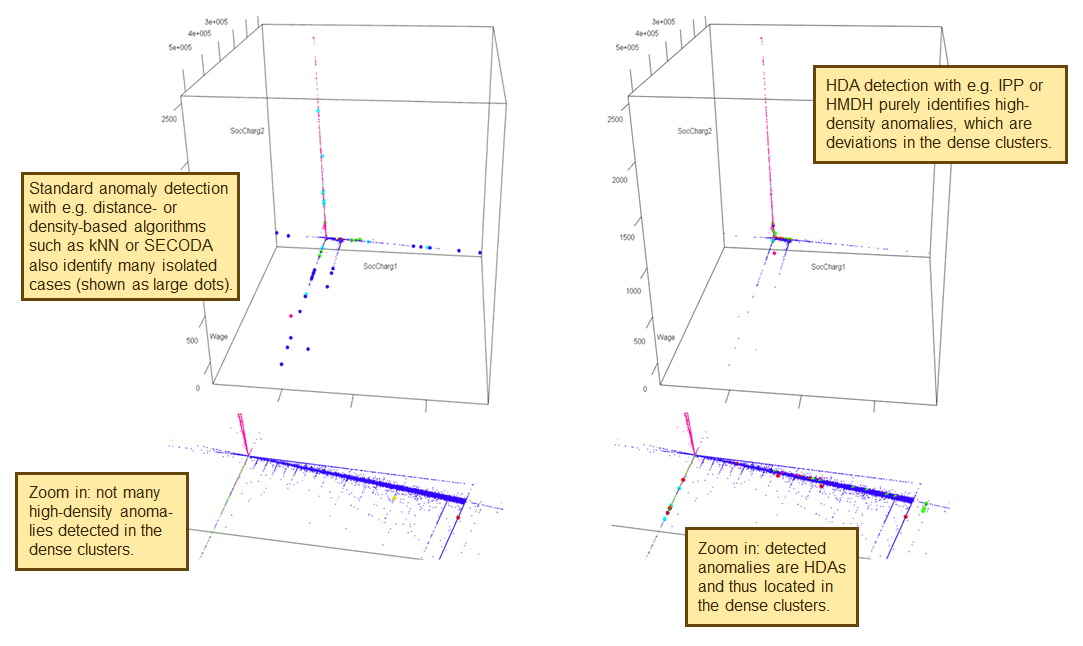
The two algorithmic frameworks have been evaluated by using several synthetic datasets and an anonymized real world sample from the Polis Administration. The evaluation has shown that especially the Iterative Partial Push method works well and consistently yields good results on all datasets. When used without the IPP or HMDH framework, the traditional general-purpose AD algorithms (such as kNN, LOF and SECODA) are often also able to identify the HDAs to some degree. However, in large sets these traditional algorithms tend to yield too many false positives to be practically used. This is because the true high-density anomalies become ‘masked’ by the isolated noise cases (which are also seen as anomalies here), which makes it extremely difficult to detect them in an effective way. To detect only HDAs it is thus necessary to use a true HDA approach, such as IPP or HMDH.
The diagram below shows the difference between using a traditional non-HDA algorithm (on the left) and the IPP method that directly targets HDAs (on the right).
In this study all the dataset’s numerical attributes are used to determine the neighborhood density (normalness), whereas the full set of attributes (including the categorical ones) are used to verify whether the case is anomalous. This analysis can be done unsupervised and essentially parameter-free. However, it does not necessarily have to be limited to this. The definition of a high-density neighborhood could take only a subset of the numerical variables into account and even include categorical attributes. Likewise, the assessment of how anomalous a case is can be based on a flexible categorical and/or numerical subspace. From this perspective each and every type of anomaly can potentially also be a high-density anomaly. However, note that this would require the analyst to manually specify which attributes to use for assessing the anomalousness and which for the neighborhood density.
How can high-density anomalies be detected? The IPP (Iterative Partial Push) and HMDH (Harmonic Mean Detection of HDAs) frameworks can be used for this. They are frameworks in the sense that they leverage traditional, general-purpose anomaly detection algorithms in their processes. Examples of such algorithms, which detect isolated or low-density cases, are distance-based algorithms, LOF and SECODA. Implementations of these frameworks in R can be found here.
To summarize, high-density anomalies provide a novel perspective on deviations in data, which differs from the traditional view of anomalies as isolated, low-density data points. A HDA is an anomaly in a highly normal neighborhood, the detection of which requires an approach to balance the degree of deviation and normalness (neighborhood density). The concept of HDAs is not only new from a theoretical perspective, but also relevant for practical use cases.
Sources:
Foorthuis, R.M. (2020). Algorithmic Frameworks for the Detection of High-Density Anomalies. Proceedings of IEEE SSCI CIDM 2020 (Symposium on Computational Intelligence in Data Mining), December 2020, Canberra Australia.
Download R code and data examples for high-density anomaly detection: SECODA resources for R.
Updated: February 24th 2021
Ralph Foorthuis
|