|
|
Typology of Outliers
This page presents information taken from Foorthuis (2018). For a preliminary version of the typology see Foorthuis (2017) and Anomaly Detection with SECODA.
In statistics and data science, outliers (or anomalies) are cases that are in some way awkward and do not appear to be part of the general pattern(s) present in the dataset.
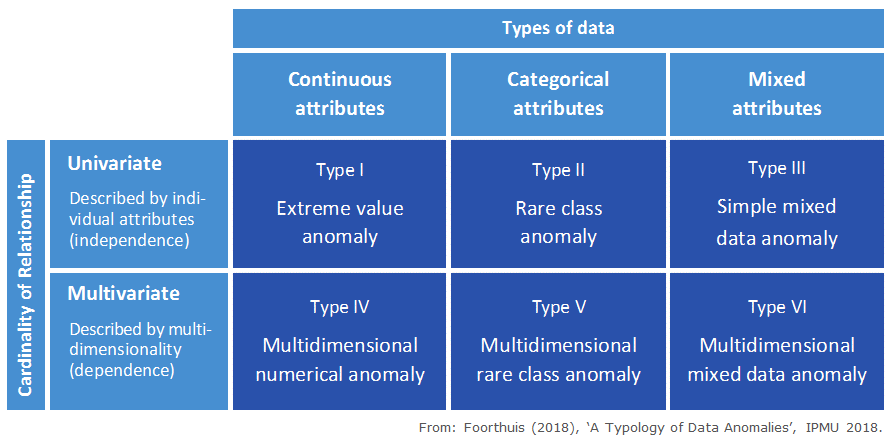
The typology defines six base types of outliers. It provides a theoretical and tangible understanding of the anomaly types a data analyst may encounter. It also assists researchers with evaluating which types of anomalies can be detected by a given anomaly detection (AD) algorithm. Finally, as a framework it aids in analyzing, amongst others, the conceptual levels of data and anomalies.
The typology differentiates between the set's 'awkward cases' by means of two very fundamental data-related dimensions:
- The types of data: The data types of the attributes (i.e. variables) that are involved in the anomalous character of a deviant case. These attributes thus have to be handled appropriately during the analysis in order for the anomaly to be detected. The data types can be continuous (numeric, such as the attribute Height), categorical (code-based, such as City) or mixed (when you have both Height and City in your dataset).
- The cardinality of relationship: How the various attributes relate to each other when describing anomalous behavior. These attributes are responsible for the deviant nature of the case. This can be univariate, which means the attributes are separately (individually) responsible for the deviant behavior, so the analysis can assume independence between the variables. The cardinality can also be multivariate, which means that the deviant behavior of the anomaly lies in the relationships between its variables, so these variables have to be analyzed jointly.

The different types of anomalies are:
- Type I - Extreme value anomaly: A case with an extremely high, low or otherwise rare value for one or multiple individual numerical attributes. A case can be an anomaly with respect to one individual variable, so Type I anomalies do not depend on relationships between attributes. Such a case has one or more values that can be considered extreme or rare when the entire dataset is taken into account. Traditional univariate statistics typically considers this type of outlier, e.g. by using a measure of central tendency plus or minus 3 times the standard deviation or the median absolute deviation.
- Type II - Rare class anomaly: A case with an uncommon class value for one or multiple categorical variables. A case can be an anomaly with respect to one individual attribute, so Type II anomalies do not depend on relationships between attributes.
- Type III - Simple mixed data anomaly: A case that is both a Type I and Type II anomaly, i.e. with at least one extreme value and one rare class. This anomaly type deviates with regard to multiple data types. This requires deviant values for at least two attributes, each anomalous in its own right. These can thus be analyzed separately; analyzing the attributes jointly is not necessary because the case is not anomalous in terms of a combination of values.
- Type IV - Multidimensional numerical anomaly: A case that does not conform to the general patterns when the relationship between multiple continuous attributes is taken into account, but which does not have extreme values for any of the individual attributes that partake in this relationship. The anomalous nature of a case of this type lies in the deviant or rare combination of its continuous attribute values, and as such hides in multidimensionality. It therefore requires several continuous attributes to be analyzed jointly to detect this type.
- Type V - Multidimensional rare class anomaly: A case with a rare combination of class values. In datasets with independent data points a minimum of two substantive categorical attributes needs to be analyzed jointly to discover a multidimensional rare class anomaly. An example is this curious combination of values from three attributes used to describe dogs: 'MALE', 'PUPPY' and 'PREGNANT'.
- Type VI - Multidimensional mixed data anomaly: A case with a deviant relationship between its continuous and categorical attributes. The anomalous case generally has a categorical value or a combination of categorical values that in itself is not rare in the dataset as a whole, but is only rare in its neighborhood (numerical area) or local pattern. As with Type IV and V anomalies, such cases hide in multidimensionality and multiple attributes need thus to be jointly taken into account to identify them. In fact, multiple datatypes need to be used, as a Type VI anomaly per definition requires both numerical and categorical data.
The value of this typology lies not only in providing both a theoretical and tangible understanding of the types of anomalies, but also in its ability to evaluate which type of anomalies can be detected by a given algorithm. Interestingly, most research publications do not make it very clear which type of anomaly can be detected. Research has often focused mainly on studying the performance of technical aspects such as speed, dataset size and number of attributes, and seems to have largely neglected the functional aspects of AD. However, it is a good practice to provide tangible insight into to the functional capabilities of an anomaly detection algorithm.
For more information about the typology, such as the difference between sets with dependent and independent data, see Foorthuis (2018).
Examples
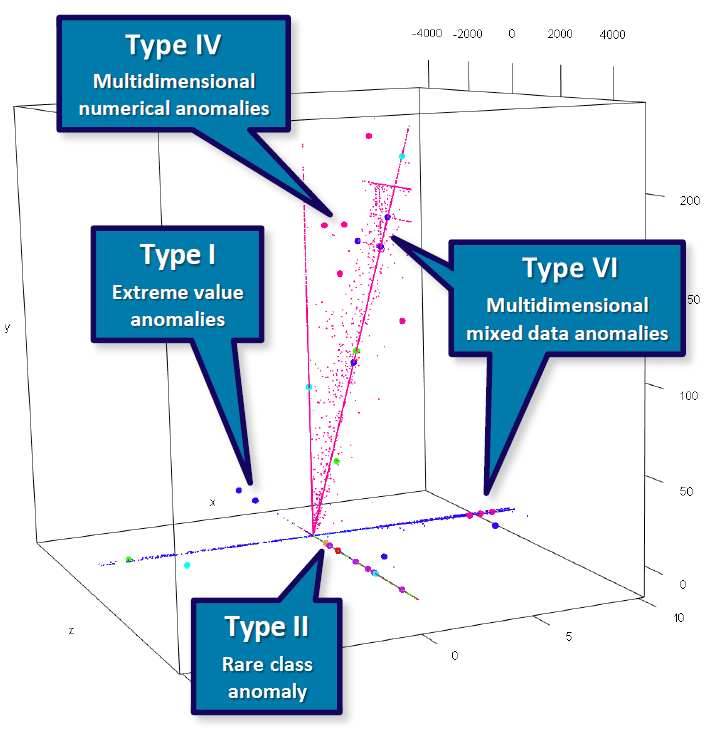
The following diagram illustrates the types of anomalies described above. The plot below features three numerical variables (represented as the cube) and one categorical attribute (represented as the color). This 4D diagram is a snapshot of income data from the Polis Administration, an official national data register in the Netherlands. The three continuous attributes represent sums of money (e.g. income and sums withheld for social security) while the categorical attribute represents a social security code. Large dots (basically the 5th dimension in the plot) represent anomalies automatically detected by an unsupervised AD algorithm, SECODA. This not only shows that different types of anomalies can be detected by such an algorithm, but also that they can indeed be encountered in practice.

The two Type I examples are extreme value anomalies because they have a very low value for the continuous variable z. The Type II example is one of the few orange cases in the set and is therefore a rare class anomaly. The Type IV examples deviate from the general multivariate pattern that can be observed for continuous attributes, making them multidimensional numerical anomalies. The Type VI examples have a color rarely seen in their respective neighborhood, which makes them multidimensional mixed data anomalies. Type VI cases can also take the form of second- or higher-order anomalies, with categorical values that are not rare (not even in their neighborhood), but are rare in their combination in that specific area (see Foorthuis 2017 for an example). The diagram does not show Type III and V anomalies. However, the rare class anomaly whould have been a Type III anomaly if it had been positioned to, e.g., the extreme left. Also, if orange would be a normal color in this dataset, but orange in combination with an additional categorical variable would make for an uncommon value pair, it would be a Type V anomaly. See Foorthuis (2018) for more visual examples of the different types of anomalies.
SECODA is an algorithm that is able to detect all these types of data anomalies. More information can be found here.
Sources
Foorthuis, R.M. (2018). A Typology of Data Anomalies. In: Proceedings of the 17th International Conference on Information Processing and Management of Uncertainty in Knowledge-Based Systems (IPMU 2018), Cádiz, Spain.
Foorthuis, R.M. (2018). The Impact of Discretization Method on the Detection of Six Types of Anomalies in Datasets. In: Proceedings of the 30th Benelux Conference on Artificial Intelligence (BNAIC 2018), November 8-9 2018, Den Bosch, the Netherlands.
Foorthuis, R.M. (2017). SECODA: Segmentation- and Combination-Based Detection of Anomalies. In: Proceedings of the 4th IEEE International Conference on Data Science and Advanced Analytics (DSAA 2017), Tokyo, Japan.
Foorthuis, R.M. (2017). Anomaly Detection with SECODA. IEEE DSAA 2017 Poster Presentation (DSAA 2017), Tokyo, Japan.
Download R code and data examples: SECODA resources for R.
Updated: December 1st 2018
Ralph Foorthuis
|

